Skip to content

2017🔗

Capturing Perfmon Counters With Telegraf

Setting up Telegraf to Capture Metrics

I had a lot of issues with getting the GO enviroment setup in windows, this time and previous times. For using telegraf, I'd honestly recommend just leveraging the compiled binary provided.

Once downloaded, generate a new config file by running the first command and then the next to install as service. (I tried doing through NSSM originally and it failed to work with telegraf fyi)

Once this service was setup and credentials entered, it's ready to run as a service in the background, sending whatever you've configured to the destination of choice.

In my test in Amazon Web Services, using EC2 with Windows Server 2016, I had no issues once EC2 issues were resolved to allow the services to start sending their metrics and show me the load being experienced across all in Grafana.
Dataedo - First Look

{{< admonition type="info" title="update 2019-02-22" >}} Image links broken. Since their product is continually improving, I'm going to just link to their product here instead so you can review their latest demo content there. Dataedo.

Overall, I've enjoyed the product and think it has been improved over time. There are SQL scripts for bulk updating certain values on their website that can help improve building a project for an existing database as well. {{< /admonition >}}

Diagramming and Documentation

Previously, I've written up on database diagrammingfor visualization of database structures. Check that out for more detailed review on what I've used.

I've recently taken a swing at this newer tool and found it very promising as a database documentation tool that bridged the gap of usability and flexibility.

TL;DR

Promising future tool for diagramming, and worth evaluating if looking to build out some documentation for the first time. For my purposes, it was missing some diagramming options that prevent me from leveraging as a replacement for my existing toolkit.

Setting Up Initial Diagrams

  1. This process was very manual, and did not allow filtering a selection of tables and dragging or bulk added to a module/category. I'm sure this will be an improvement quick to be implemented. At the current time, it was very tedious when dealing with a large database structure.
  2. Once assigning a module, and then clicking to the next table, a modal pop-up would ask if I wanted to save instead of letting me continue to assign modules. To bypass this I had to hit Ctrl+S to save prior to navigating to the next table or dismiss the dialogue by clicking.
  3. Discovered that moving to the Module > ERD tab allowed assignment of multiple tables or views to the ERD diagram. This provided the solution of easily assigning multiple objects to the ERD diagram, but did not add the tables to the Module itself, requiring the full manual step mentioned before. The filter tab was useful, though I was hoping for a basic search filter with a negation clause to help trim down the results selected. Example: CoreTables -ETL to allow easily filtering large amounts of objects. Maybe that would be a future enhancement the development team could add.

The only difference I could see for adding tables to the ERD when adding previously to the Module was that they were highlighted in bold before the other tables

Exporting Customization Is Easy

Exporting documentation provided immediate feedback on generating a custom template, along with all the required files. This was a definite plus over some other tools I've worked with, as it promoted the customization that would be required by some, with all the necessary files generated. My props to the developers of this, as this showed a nice touch for their technical audience, not forcing the user into a small set of options, or making it complicated to customize.

No delete button for the CustomTemplate was a bit confusing, but an easy fix for them in the future. At this time, you'd just delete the folder in Dataedo/Templates/HTML and they won't show up in the template dialogue.

During the export process you also have the option of saving the export command options you already setup to a dataedo command file to make it easily automated. That's a nice touch!

ERD Diagrams

PROS

  1. First, the snapping and arrangement of the connectors was excellent. This allows easy rearrangement with clean relationship lines shown.
  2. The generated documentation files looked fantastic, and with some improvements and customization, I could see this generating a full documentation set that would make any dba proud :-)

CONS

  1. I could not find any "auto-arrange" or "preferred layout" options to arrange in a set pattern if I didn't like the way I had changed it or it had laid it out initially
  2. No option to show the columns that have FK relationships. The relationship connector could be shown, with a label, but nothing to match Column5 that had a FK but was not part of the primary key to the matching column on another table. The diagram displayed only the PK columns. For my requirements, this was a critical omission as I need to display PK, and FK.

Core Features I'd Like To See

  1. Search box so that I could replace CHM files with the local HTML document. This would require a search mechanism to allow easily finding what the user needed. Currently, no provider I've tested has implemented a local html package that included a static file search that worked well.
  2. Improved ERD with FK/PK
  3. Improved ERD with auto-layout options. Based on my initial research I'd say this is a tough one to implement, but giving a basic layout option to the user and then allowing customization from there would be a great help.
  4. Grouping objects in the ERD to group related elements in part of a larger module
  5. Producivity enhancements to allow quickly creating multiple modules, and dragging objects into the modules. Eliminate manual 1 by 1 actions to work with those.

end comments

Well done Dataedo team :-) Looking forward to the continued improvements. I've found visualization of database structures is very helpful to design, and a new toolkit out like yours promises to provide even more great tools to use to do this.

InfluxDB and Annotations

{{< admonition type="info" title="Updated: 2020-04-29" >}} broken image links removed {{< /admonition >}}

This post assumes you've already setup InfluxDB and have Grafana running.

Inserting annotations

Annotations are not a special type of resource, instead it's just another metric that you query with a feature in Grafana to display on other metrics. This means the same insert Line Protocol applies to the Annotation.

This post on maxchadwick.xyz greatly helped me get started: Creating Grafana Annotations with InfluxDb Max Chadwick

Per Max's original post it supports html as well, so you could link for example to a build, test result, or anything else you want to link to from your performance statistics.

This provides an annotation on your timeline in a nice format for browsing through the timeline. I can see usage cases for identifying specific activity or progress in tests, helping coorelate the performance metrics with known activity steps from a build, script, or other related tasks. You could have an type of activity trigger this powershell insert, providing a lot of flexibility to help relate useful metrics to your monitoring.

My personal use case has been to ensure load testing start/end times and other significant points of time in a test are easily visible in the same timeline I'm reviewing metrics on.

Warning: I did experience performance degradation with Grafana and many annotations on a timeline. I found just disabling the annotations kept this from occurring, so you only pull them when youd them.

Adding Annotations to Grafana

Now that you have the results being inserted into InfluxDB, you can query these in Grafana as annonations to overlay your graphs.

Potential Uses

I could see a whole lot of uses for this!

  • insert at build related activity
  • Windows update
  • Specific Database Related Maintenance like Ola Hallengren's index optimize or database integrity check

Monitoring always loses it's value when you have a limited picture of what is happening. Triggering relevant details for stuff that might help analyze activity might be the key to immediately gaining an understanding on what is causing a spike of activity, or of better evaluating the timeline of a load test.

Spotify vs Google Play

I've recently switched over to Spotify for the nth time to explore the Spotiverse world and compare as a long time Google Play Music user. This is a big deal for me, as I was a first adopter of Google Play and have used it before All Access, and subscribed immediately to All Access once it was released. As a ravenous music consumer, I've preferred the subscription model for instant, on demand access. This is my personal comparison of some of the strengths and weaknesses of each, compiled over actual usage. Hopefully, it will help anyone who is interested in the differences and trying to decide.

Spotify

  1. Playlists: A wealth of socially driven playlists exist with Spotify. You can even create a adhoc playlist on the fly via their api from your own music app. They also have collaborative lists so it's very easy to build a playlist with like minded folks.
  2. Crossfade: It's a pretty smooth experience to have tracks merge seamlessly. Setting 12 secs of crossfade makes it feel like a DJ is mixing up a radio experience for you.
  3. Radio is getting better than my first experience of it, at playing related music.
  4. Explicit filtering. Spotify doesn't offer as a global setting. They suprisingly seem to have ignored user requests for this. Makes it a little less family friendly if you aren't careful.
  5. Ability to follow artists helps with good "new releases" I'd be interested in.

Google Play

  1. Radio is ok.
  2. Offline: Pinning a radio station gives you a fresh mix of songs, but not too many. Pinning a playlist in spotify for offline = every song downloaded.
  3. Quality designated for mobile vs wifi. Spotify just has Download vs Stream, with no designation between streaming on a wifi network and mobile network.
  4. Explicit filter is implemented.
  5. Terrible new release feed. For a while it never even updated (some bug in sub-genre at the time I believe). No way to mark uninterested, so recommendations are pretty off.

Things I Can't Believe Aren't Fixed

  1. Global Thumbs Down. Why is this not there! Spotify should add a global thumbs down, instead of just in radio stations. I should be able to dislike a song to remove it from any playlist or the recommended discovery songs. Google Play has a little better experience with this, but still far to limited.

algorithms taking away my choice?

This seems speak to the mentality today that algorithms and user behavior drive all the results, not requiring user feedback. The negative to this is for people like myself who want to improve the results I'm offered... well we are left out in the cold. Pandora offers the best radio design out there, imo. They rely on feedback to help ensure the results are provided as the user wants. I'd like to see this design choice in more of the music services instead of them trying to assume they've identified my preferred choices.

honorable mention Pandora

Overall, the winner for me is Spotify. However, if Pandora's new service wasn't so darn limited in selection, inconsistent with on demand availability, and implemented on desktop as well as mobile I'd recommend them. As it stands, I can't recommend it at this time.

ANTS Performance Profiler for the SQL Server Dev

{{< admonition type="info" title="2019-11-10" >}} Image links are gone due and due to age of post, unable to recover {{< /admonition >}}

There are a few .NET tools that until recently I haven't had the chance to work with as much, specifically ANTS Memory Profiler and ANTS Performance Profiler. The memory profiler is more useful for someone focused on memory leaks which a SQL Dev isn't as focused on for performance tuning. However, there are major benefits for diving into SQL Performance tuning with ANTS Performance profiler. I think I'd say this tool makes the epic category of my #cooltools kit.

One of the most challenging processes for profiling activity is really identifying the single largest pain point. Trying to line up timings with the SQL plans and the application side by side is a big timesaver, and Red Gate improved ANTS Performance profiler to include the executed SQL with execution plans, making it a single stop to profile and get some useful information.

There are other ways to get useful information, such as running Brent Ozar's First Responder kit queries, Glenn Berry's diagnostic queries, Query Store, and more. These tend to focus on server performance. As someone working in software development, there is something to be said for the simplicity of running the application and profiling the .NET and SQL performance in one captured & filtered result set. It's a pretty quick way to immediately reduce noise and view a complete performance picture of the application.

For performance profiling, Visual Studio has an option called Performance Profiler. I found my initial look at it to be positive, just really noisy.

Disclaimer: As a member of the Friends of Red Gate program, I get to try out all the cool Red Gate tools. Lucky me! This doesn't bias my reviews as I just like great tools that help me work with SQL server. This is one of them!

Profiling .NET App

At the time of this articles publishing, there is no 2017 Visual studio extension which makes this process a few clicks less. For now, it still is simple. All you do is go to the bin/debug folder and select the executable you want to profile. Attaching to the .NET excecutable is required for my purpose, as attaching to an existing process doesn't give you the ability to get all the SQL calls which we definitely want.

Timeline & Bookmarks

During the profiling you can perform actions with the application and create bookmarks of points in time as you are performing these actions to make it easier to compare and review results later.

Reviewing Results

This is based on the call tree. It shows code calls, and is a great way to be the database guy that says... "hey SQL server isn't slow, it's your code" :-)

Database Calls

The database calls are my favorite part of this tool. This integration is very powerful and lets you immediately trim down to the calls made with timings and associated executed sql text. RG even went and helped us out by providing an execution plan viewer! When I first saw this I fell in love. Having had no previous experience with Entity framework of other ORMs, I found the insight into the performance and behavior of the application to be tremendously helpful the first time I launched this.

Exporting HTML Report

A benefit for summarizing some action for others to consume is the ability to select the entire timeline, or narrow to a slide of time, and export the results as a HTML report.

This was pretty helpful as it could easily provide a way to identify immediate pain points in a daily performance testing process and focus effort on the highest cost application actions, as well as database calls.

Automation in Profiling

RG Documentation shows great flexibility for the profiler being call from command line. I see a lot of potential benefit here if you want to launch a few actions systematically from your application and establish a normal performance baseline and review this report for new performance issues that seem to be arising.

I generated some reports automatically by launching my executable via command line, profiling, and once this was completed, I was provided with a nice formatted HTML report for the calls. At the time of this article, I couldn't find any call for generating the SQL calls as their own report.

TL;DR

Pros

  1. Incredibly powerful way to truly get a picture into an application's activity and the true pain points in performance it is experiencing. It truly helps answer the question very quickly of what is the area that needs the most attention.
  2. Very streamlined way to get a summary of the SQL activity an application is generating and the associated statements and execution plans for further analysis.

Cons

  1. At times, with larger amounts of profiled data the application could feel unresponsive. Maybe separating some of the panes activity into asynchronous loads with progress indicators would make this feel better.

** Neutral/Wishlist **

  1. More an observation than complaint, but I sure would like to see some active work being released on this with more functionality and SQL performance tuning focus. Seems to be stable and in maintenance mode rather than major enhancements being released. For those involved in software development, this tool is a powerful utility and I'd love to see more improvements being released on it. RedGate... hint hint? :-)
  2. I'd like to see even more automation focus, with the option of preset Powershell cmdlets, and team foundation server task integration to help identify changes in performance patterns when scaled up. Leveraging this to help baseline application performance overall and report and develop trends against this might help catch issues that crop up more quickly.

additional info on more profiling focused apps

Since the material is related, I thought I'd mention a few tools I've used to help profile activity, that is not focused on a wholistic performance analysis, and more about activity.

  1. For more "profiling" and less performance analysis my favorite SQL profiling tool Devart's DbForge Sql Profiler uses extended events and while amazing, isn't as focused a tool for app and SQL performance analysis. If you haven't checked that tool (free!) out I highly recommend it vs running profiler. It uses extended events and provides a nice experience in profiling and reviewing results. Super easy to use and very flexible for filtering/sorting/exporting. The only issues I have with it are the filtering setup is annoying, but tolerable to work with, and no execution plans that I've been able to find built in, unlike running extended events in SSMS directly. Hopefully, Devart will recognize what an awesome tool they've made and continue to push it forward.
  2. For just getting Entity framework and other ADO.net calls you can use intellitrace with the option for ADO.NET tracing enabled. I found this nice, but a little clunky to use compared to Linq Insight or other options mentioned. It's included with visual studio so if only using periodically then this would be ok to work with.
  3. For a cleaner implementation of Entity Framework Profiling than the Intellitrace route use Devarts dbForge Linq Insight (I love this tool for cleaner profiling of ADO.NET activity when you aren't focused on overall performance of the application) and are working in Visual studio.

If all else fails... you can always succumb to dark side and just use SQL Profiler or worse yet...SSMS activity monitor :-)

Update SSMS With PS1

{{< admonition type="Update" title="Updated: 2018-03-29" >}} Use Chocolatey. This page keeps changing it's structure, so the regex to parse for Ketarin and this PS1 script keep breaking. Updated to latest version as of 2018-03-29, but recommend checking out the Chocolately Package created for SSMS for this by flcdrg as chocolately is a much nicer way to keep up to date and more likely long-term to succeed than my gist :-) To use chocolatey (after setup), you only have to use choco upgrade sql-server-management-studio which is much easier to remember than using this gist. Still a nice light-weight tool.

Also, for less overhead, investigate SQL Operations Studio instead of SSMS for those situations you need to run some queries on a machine. Less overhead, size, and complexity for some nice basic SQL Server management functionality (even if it is missing my precious SQL Prompt)

{{< /admonition >}}

With how many updates are coming out I threw together a script to parse the latest version from the webpage, and then provide a silent update and install if the installed version is out of date with the available version. To adapt for future changes, the script is easy to update. Right now it's coded to check for version 17 (SSMS 2017). I personally use Ketarin, which I wrote about before if you want a more robust solution here: Automating SSMS 2016 Updates & Install

The bat file is a simple way for someone to execute as admin.

Hope this saves you some time. I found it helpful to keep a bunch of developers up to date with minimal effort on their part, since SSMS doesn't have auto updating capability, and thus seems to never get touched by many devs. :-) Better yet adapt to drop the SSMS Installer into a shared drive and have it check that version, so you just download from a central location.

External Tool VSCODE called from SQL Management Studio

Previous Related Post: Split personality text editing in SSMS with Sublime Text 3

In this prior post I wrote about how to call Sublime Text 3 from SSMS to allow improved text manipulation to be quickly called from an active query window in SQL Management Studio. Vscode is a newer editor from Microsoft, and the argument calls took a little work to get working. Here is what I found for having your SQL file open in vscode via call from SSMS (I imagine also works in Visual Studio 2017 this way as well).

External Tools Setup for Vscode

Title:  "Edit In VSCODE"
Command C:\Program Files (x86)\Microsoft VS Code\Code.exe
Arguments: --reuse-window --goto $(ItemPath):$(CurLine):$(CurCol)

Please note unsaved files such as "SQLQuery11.sql" that haven't been explictly saved are not accessible to this, so it will just open an empty file. I have not found any workaround for that, as I believe the tmp files are cached in one of the .DAT files. I've not had luck finding the Autorecover or temp files with the actual contents until saved.

Add User To Admin Group on Machine

In setting up some build machines for development, it's tedious to go and add several users to the admin group. Here's a snippet to expedite that task and help you setup more quickly.

Best Practices: Defining Explicit Length for Varchar/Nvarchar

SA0080 : Do not use VARCHAR or NVARCHAR data types without specifying length. Level: Warning

When using varchar/nvarchar it should be explicitly defined. This can be a very nasty bug to track down as often nothing will be thrown if not checked in an application. Instead, ensure your script explicitly defines the smallest length that fits your requirements. The reason I rate this as a very dangerous practice, is that no error is thrown. Instead, the results being returned will be shorter than expected and if validation checks aren't implemented this behavior can lead to partial results returned and used. Make sure to always explictly define length!

Here's an short example script that demonstrates the behavior.

Powershell Module Improvements for SQL Server in 2017

{{< admonition type="info" title="Updated: 2018-03-19" >}} I don't use these much, if any now. Check out dbatools which is a much better module with a full range of features to save you a ton of time. {{< /admonition >}}

simple setup

A major improvement that seems to have quietly slipped into the sql developers world is an improved SQLServer powershell module. The improved module is finally available in the powershell gallery, allowing a super quick setup on a server. No more installing SSMS to get them!

This is very promising, and great if you want to leverage some of the functionality on various build servers, or other machines that might not have SSMS installed.

Powershell Gallery - SqlServer

new cmdlets

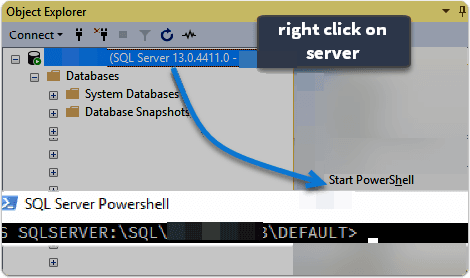
In reviewing, I ran across a few new cmdlet's as well. For instance, you could easily right click on a table and output the results into a powershell object, json, csv, gridview, or anything else you want. This is great flexibility.

exploring-sql-path-provider

In versions of SQL Server (as of 2012 or earlier) I believe the version SQL Server was utilizing was out of date with the installed version. For instance, on Windows Server 2012 with Powershell ISE reporting PsVersion of 4.0, Sql Server reported version 2.0 being utilized.

In 2014 instances I had, the powershell invoked from SSMS shows the matching up to date version, which gives much better capability and functionality.

simple benefits for the inquiring mind

If you are not familar with the potentional benefits from being able to quickly invoke a powershell prompt and use SQL server cmdlets (prebuilt functionality that is easily called), I can give you a few use cases.

If you were asked to run a query, then export the results to a spreadsheet, it would be relatively simple as a cut and paste. However, if you needed to loop through every table in the database, and put each one to it's own excel workbook, powershell would allow you to quickly loop, convert the datatable returned into an excel worksheet, and either append into new worksheets, or create completely seperate new files. For automation possibilities, you've got a tremendous amount of potentional time savings if you can get comfortable with powershell.

In my case, I've found Powershell to be a great tool to help me understand more of the .NET framework as I use various cmdlets or .NET accelerators.